The customers.csv data file contains a lot of unsorted customer records. Our brief is the following
| • | Create 2 output files : one for US customers and another for the non-US customers. |
| • | Make sure that all output is sorted by Country and Company Name. |
Let's start of where we left off with our LoadCustomers graph and make some modifications. We will end up with a graph like this.
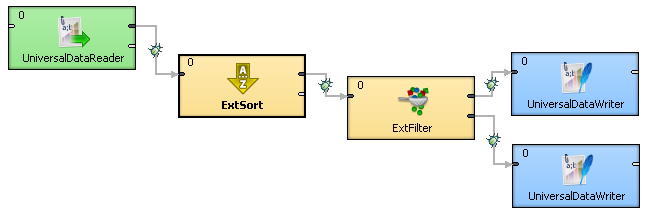

|
| 1. | Open the Load Customers graph (if not already open) and save it as "Sort and Filter". |
| 2. | Delete the Reformat and Thrash components from the graph. |
| 3. | We should sort all the loaded customer data before we do anything else. If we did this at the end we would have to include 2 sort components - one for the US output and another for the others. So, drag in the "ExtSort" component (located under Transformers) and connect it to the Reader. Make sure the Edge has the "Customers" metadata assigned to it. |
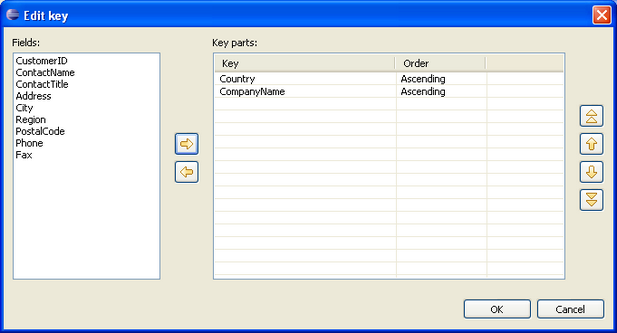
| 4. | Now you should edit the ExtSort's properties. You can sort on one or more key fields. Choose the "Sort Key" property. Select the property and press the '...' button to open the dialog. |
| 5. | Select the Country and the CompanyName fields to sort on. |
| 6. | Next, drag in the ExtFilter component and place it to the right of the ExtSort. There are different ways to divide data up, this is the simplest. You specify a condition. If the condition is met, then that data is sent to the first output port. All others are sent to the second output port. |
| 7. | Connect the ExtSort component to the input of the ExtFilter component and make sure the Edge has the "Customers" metadata assigned to it. |
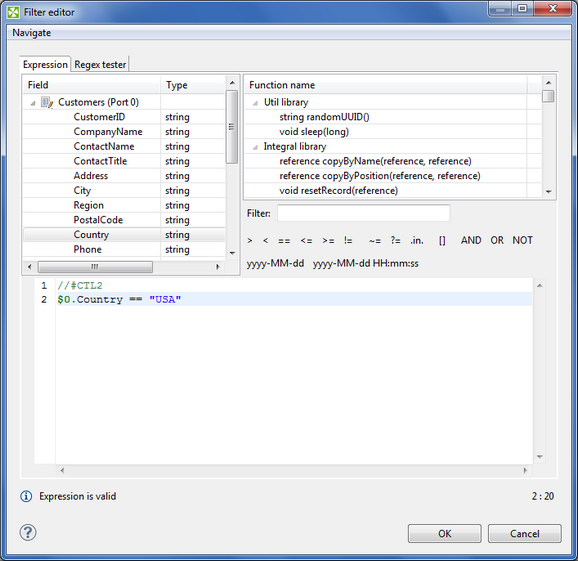
| 8. | To set the condition, edit the properties and then edit the "Filter expression" property by pressing the '...' button. |
| 9. | You can now type in an expression in the lower pane or use the various options in the upper panes to construct an expression. Double click a Field or Function Name to have it appear in the script line in the lower pane. When done it should look like this. |
| 10. | Add a Universal Data Writer. Then copy the component and paste a new one into the graph. |
| 11. | Double-click both writers, click File URL and change the first one's output filename to be "${DATAOUT_DIR}/USCustomers.csv" and the other one to "${DATAOUT_DIR}/NonUSCustomers.csv". |
| 12. | Connect and Edge from the first output port of the ExtFilter to the US customer data writer. |
| 13. | Connect the second output port of the ExtFilter to the non US customer data writer. |
| 14. | Make sure that you assign Customers metadata to all Edge lines. |
| 15. | Now set some debugs on the Edges and run your graph. |
| 16. | Inspect the debugs a right click on the debugged Edges and then select View Data. |
| 17. | Check the output folder (data-out) for the newly created output files. |
|
If the graph fails, make sure that all Edges have the "Customers" metadata assigned. Leaving one unassigned will cause it to fail.